
U17
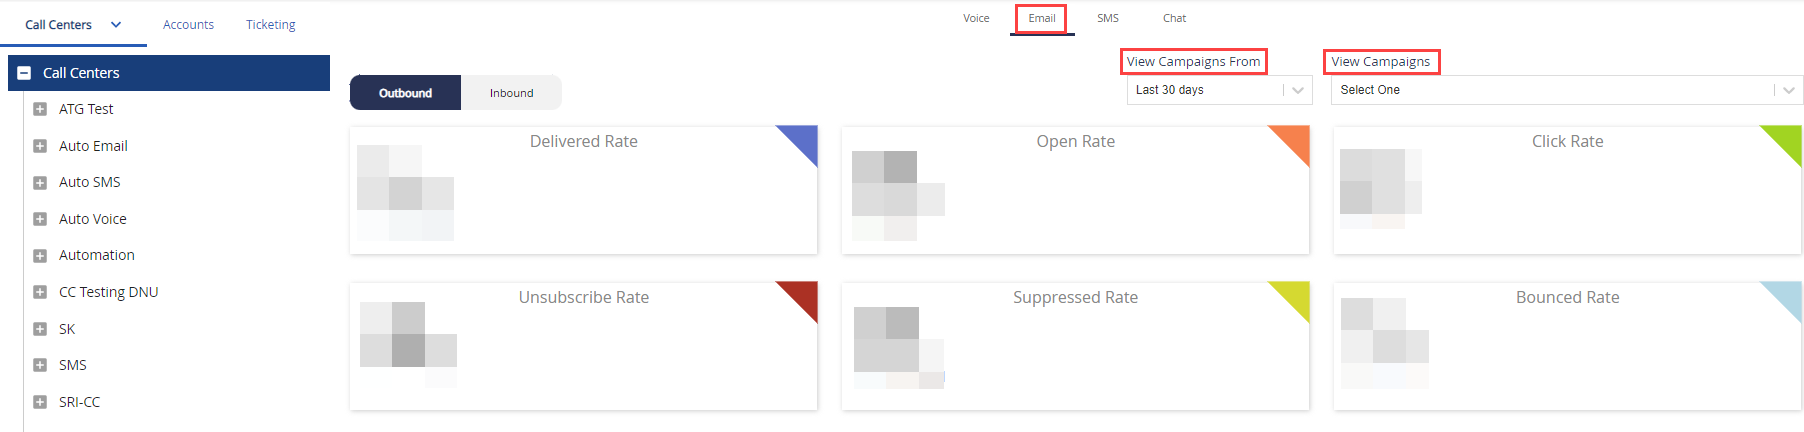
The LiveVox Portal (LVP) provides information about the outbound emails for active campaigns. The Outbound tab of the Email Monitor dashboard provides statistical information regarding outbound emails for a selected active campaign over a period of time.
By default, the Email Monitor dashboard displays statistics for email campaigns that were run over the past 30 days. However, you can change the time period using the View Campaigns From field, which contains the following options:
- Today's
- Last 7 days
- Last 30 days
- Last 90 days
In addition, you can select the campaign for which you want to view the outbound statistics by using the View Campaigns field, which contains a list of all active campaigns.
The following information is displayed:
| Statistic | Description |
| Bounced Rate |
Percentage of emails that are not delivered to the customer. |
| Click Rate |
Percentage of emails in which customers clicked a link. |
| Delivered Rate |
Percentage of emails that are delivered to customers. |
| Open Rate |
Percentage of emails that are opened by customers. |
| Performance |
A chart representing the performance of the email channel based on the above statistics, along with the number of launched (delivered) emails and the number of emails remaining to be launched. In the chart, the x-axis represents dates and the y-axis represents the number of emails that are delivered, opened, clicked, unsubscribed, suppressed, or bounced. |
| Suppressed Rate |
Percentage of emails that are suppressed due to the suppression list. |
| Unsubscribe Rate |
Percentage of emails from which customers unsubscribed. |
U19
The LiveVox Portal (LVP) provides information about the outbound emails for active campaigns. The Outbound tab of the Email Monitor dashboard provides statistical information regarding outbound emails for a selected active campaign over a period of time.
By default, the Email Monitor dashboard displays statistics for email campaigns that were run over the past 30 days. However, you can change the time period using the View Campaigns From field, which contains the following options:
- Today's
- Last 7 days
- Last 30 days
- Last 90 days
In addition, you can select the campaign for which you want to view the outbound statistics by using the View Campaigns field, which contains a list of all active campaigns.
The following information is displayed:
| Statistic | Description |
| Bounced Rate |
Percentage of emails that are not delivered to the customer. |
| Click Rate |
Percentage of emails in which customers clicked a link. |
| Delivered Rate |
Percentage of emails that are delivered to customers. |
| Open Rate |
Percentage of emails that are opened by customers. |
| Performance |
A chart representing the performance of the email channel based on the above statistics, along with the number of launched (delivered) emails and the number of emails remaining to be launched. In the chart, the x-axis represents dates and the y-axis represents the number of emails that are delivered, opened, clicked, unsubscribed, suppressed, or bounced. |
| Suppressed Rate |
Percentage of emails that are suppressed due to the suppression list. |
| Unsubscribe Rate |
Percentage of emails from which customers unsubscribed. |